Getting Started
I’ve recently decided to explore AI-assisted vulnerability research. Rather than spending too much time debating which tools or models to use, I wanted to get my hands dirty with a real vulnerability.
PHP2Shell happened to be making waves in the security community, so it seemed like a good place to start. Despite all the buzz, I knew very little about how it actually worked.
So I did what I usually do when exploring an unfamiliar vulnerability: I looked for a working PoC.
That led me to StealMyBitcoin-PoC, a GitHub repository that included both an exploit script and a Docker-based repro environment.
A Working PoC, but Not Quite a Debugging Lab
It was a great starting point. The exploit worked, but the environment had a couple of limitations that made deeper investigation difficult:
- No debugging symbols. The PHP binary came from an official Docker image without matching DWARF symbols, making source-level debugging difficult.
- Multiple PHP workers. The server ran four worker processes, adding unnecessary complexity when attaching a debugger and tracing individual requests.
Neither was a problem if all I wanted was to run the PoC. But I wanted to simply the debugging first.
Building a Better Research Environment
So I decided to build my own debugging environment with three goals:
- Debuggable: Rebuild PHP with matching DWARF symbols so I could inspect its internals with debugger like LLDB, in source code level.
- Simple: Use a single PHP worker, if possible, to make request tracing and breakpoints more predictable.
- Reproducible: Package the environment in Docker so the experiments could be repeated without rebuilding everything manually.
This post walks through how I built that environment, including a few unexpected lessons along the way. including a few unexpected lessons along the way.
Get the Lab
I’ve published the debugging environment on GitHub:
The repository contains the Docker-based lab and the setup needed to reproduce the experiments in this article.
You can follow along with your own environment, or simply browse the repository as we work through the build and debugging process.
The Missing Symbols?
My first step was to attach LLDB to the PHP process running inside the original Docker container.
That part worked. But there was a catch: the PHP executable was stripped, and I didn’t have matching debugging symbols. I could inspect the assembly, but following the execution back to PHP source code was another story.
Naturally, I wondered whether I could simply download the missing symbols.
Alpine Linux provides debug symbol packages, so that seemed like a reasonable place to start. Unfortunately, the official PHP Docker image builds PHP from source rather than installing Alpine’s PHP package. The symbols from Alpine’s php84-dbg therefore weren’t a match, even though the PHP versions might be identical.
Eventually, I decided to rebuild PHP with DWARF symbols myself.
But first, I needed to figure out how the original PHP binary had been built.
Rebuilding PHP: Same Version, Different Binary
The original environment used the php:8.4.26-fpm-alpine3.23 image. Rather than writing a Dockerfile from scratch, I went to the official PHP Docker image repository and looked for the build recipe corresponding to that version.
The key was to use the historical Dockerfile, not whatever was currently on the main branch. Docker image definitions change over time, and even a seemingly minor change to the compiler flags or system dependencies can produce a different binary.
I checked out the repository at the commit containing the PHP 8.4.26 Alpine 3.23 build:
git clone https://github.com/docker-library/php.gitcd phpgit checkout 79320e28b93fdc720d6f07d150709310cf54e757cd 8.4/alpine3.23/fpm
From there, I made two changes to create a debug-friendly build.
First, preserve DWARF information during compilation.
The original PHP build used optimized compiler flags, including -O2. I added -g without removing the optimization:
ENV PHP_CFLAGS="-g -fstack-protector-strong -fpic -fpie -O2 -D_LARGEFILE_SOURCE -D_FILE_OFFSET_BITS=64"
This keeps the build close to its release configuration while generating source-level debugging information. It also means some variables may still be optimized out or functions inlined—which is worth remembering when debugging.
Second, save the debugging information before the PHP binary is stripped.
The official Docker build strips the installed executable to reduce the image size. I inserted the following commands after make install and before stripping:
apk add --no-cache binutilsmkdir -p /opt/debugobjcopy --only-keep-debug /usr/local/bin/php /opt/debug/php.debug
This gives us two files: the PHP executable and a separate DWARF file that LLDB can load.
I saved the modified build recipe as Dockerfile.debug and built the image:
docker build -f Dockerfile.debug -t php8426-debug:lab .
At this point, I had a debug-enabled PHP build. The next question was whether its symbols actually matched the executable—and how closely the rebuilt binary matched the original Docker image.
The Binary That Didn’t Match
With the new image built, I had two things to verify: whether the debugging symbols matched my rebuilt PHP executable, and whether that executable matched the original Docker image.
The first check passed. The second didn’t.
I compared three PHP binaries:
- Stock: The PHP executable extracted from
php:8.4.26-fpm-alpine3.23. - Baseline: PHP rebuilt from the historical Dockerfile without adding
-g. - Debug: The same rebuild, this time with
-gand DWARF information preserved.
I used readelf to inspect their ELF Build IDs and compared the SHA256 hashes of their .text sections.
| Binary | ELF Build ID | .text SHA256 |
|---|---|---|
| Stock | 4a79c7103dc1ba5f1b970d546120da8df5d1e46c | 60595abaecd0c03d4e06f335e4035992bf692192e29acea168f2e194ff5a1e2c |
| Baseline | f819d0929c5f7278312cb43ea1d05047a16380cd | d42a09dcac17e2dc373d045482a092105345bcffea22b3bc70c0e683fe73a1ca |
| Debug | b2b8ba758095c875f179b98447bc99bdbe669959 | d42a09dcac17e2dc373d045482a092105345bcffea22b3bc70c0e683fe73a1ca |
Two things stood out.
First, the baseline and debug builds had identical .text sections. Adding -g produced debugging information without changing the machine-code bytes in this particular build. Their overall Build IDs still differed, which is consistent with changes elsewhere in the ELF files.
Second, neither rebuild matched the stock PHP executable. Even though I used the same PHP version and historical Dockerfile, the original image’s .text hash was different.
That wasn’t entirely surprising. Rebuilding from the same source and Dockerfile doesn’t necessarily reproduce the original binary byte for byte. Toolchain versions, dependency revisions, build inputs, and other environmental differences can matter.
I briefly considered chasing a byte-for-byte match, but that would have turned this into a reproducible-build investigation.
My actual goal was simpler: obtain a PHP executable and DWARF symbols that matched each other, so I could reliably step through PHP’s source code.
And I had exactly that.
The next step was to put those symbols to work in LLDB.
The Binary That Didn’t Match
With the new image built, I had two things to verify: whether the debugging symbols matched my rebuilt PHP executable, and whether that executable matched the original Docker image.
The first check passed. The second didn’t.
I compared three PHP binaries:
- Stock: The PHP executable extracted from
php:8.4.26-fpm-alpine3.23. - Baseline: PHP rebuilt from the historical Dockerfile without adding
-g. - Debug: The same rebuild, this time with
-gand DWARF information preserved.
I used readelf to inspect their ELF Build IDs and compared the SHA256 hashes of their .text sections.
| Binary | ELF Build ID | .text SHA256 |
|---|---|---|
| Stock | 4a79c7103dc1ba5f1b970d546120da8df5d1e46c | 60595abaecd0c03d4e06f335e4035992bf692192e29acea168f2e194ff5a1e2c |
| Baseline | f819d0929c5f7278312cb43ea1d05047a16380cd | d42a09dcac17e2dc373d045482a092105345bcffea22b3bc70c0e683fe73a1ca |
| Debug | b2b8ba758095c875f179b98447bc99bdbe669959 | d42a09dcac17e2dc373d045482a092105345bcffea22b3bc70c0e683fe73a1ca |
Two things stood out.
First, the baseline and debug builds had identical .text sections. Adding -g produced debugging information without changing the machine-code bytes in this particular build. Their overall Build IDs still differed, which is consistent with changes elsewhere in the ELF files.
Second, neither rebuild matched the stock PHP executable. Even though I used the same PHP version and historical Dockerfile, the original image’s .text hash was different.
That wasn’t entirely surprising. Rebuilding from the same source and Dockerfile doesn’t necessarily reproduce the original binary byte for byte. Toolchain versions, dependency revisions, build inputs, and other environmental differences can matter.
I briefly considered chasing a byte-for-byte match, but that would have turned this into a reproducible-build investigation.
My actual goal was simpler: obtain a PHP executable and DWARF symbols that matched each other, so I could reliably step through PHP’s source code.
And I had exactly that.
The next step was to put those symbols to work in LLDB.
The First Breakpoint
With the rebuilt PHP binary and matching DWARF symbols ready, it was finally time to put LLDB to work.
There was one small complication: PHP was running inside an Alpine Linux container, while LLDB was running on my Ubuntu host.
Fortunately, I didn’t need to install a debugger inside the container. Docker processes are still Linux processes, and the host can attach to them using their host PIDs, provided the necessary permissions are available.
Finding the PHP Process
First, I identified the PHP processes running inside the debug container:
docker top ctf-cross-php-poc-debug
For any selected host PID, I could also inspect its PID namespace mapping:
grep NSpid /proc/<HOST_PID>/status
This was a useful reminder that the PID displayed inside a container isn’t necessarily the PID the host debugger needs.
Attaching LLDB with DWARF
Next, I launched LLDB with the rebuilt executable. A trick I learned is for process inside docker, you can directly debug from the host, no need to debug from inside docker.
sudo lldb ~/php2shell-debug/bin/php-rebuilt
Inside LLDB, I loaded its matching debug symbols and configured source mapping:
target symbols add /home/ubuntu/php2shell-debug/bin/php.debugsettings append target.source-map \ /usr/src/php \ /home/ubuntu/php2shell-debug/src/php/php-8.4.26
Why the source map?
The PHP build was compiled inside Docker, where the source lived under /usr/src/php. On my Ubuntu host, the same source code lived elsewhere. Without that mapping, LLDB could know the original file paths from DWARF but fail to find the corresponding source files.
Finally, I attached to the PHP process:
process attach --pid <HOST_PID>
The debugger now had everything it needed: a live PHP process, the matching executable, DWARF symbols, and the corresponding source code.
A Breakpoint Inside PHP
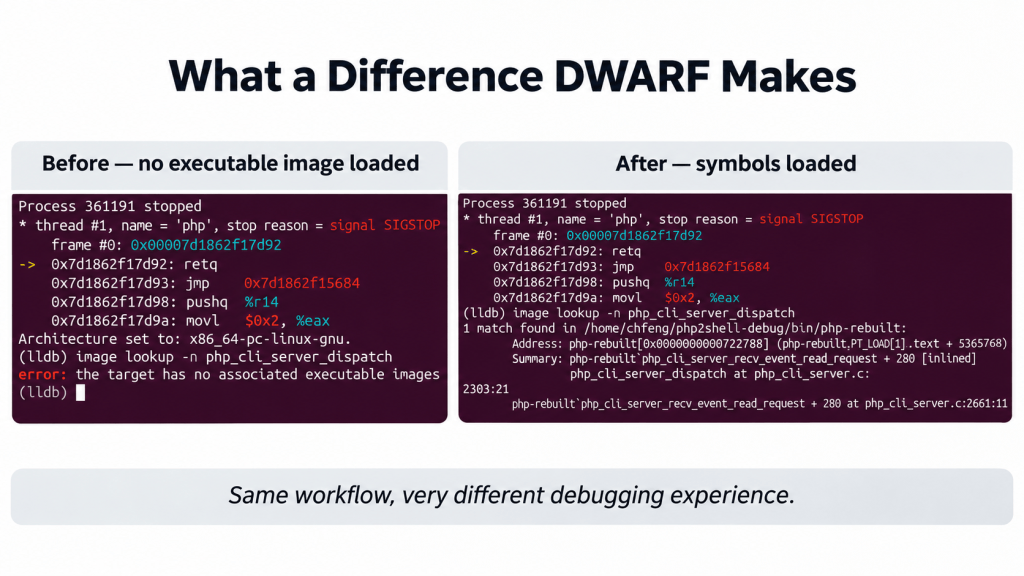
For the first test, I chose php_cli_server_dispatch(), a function involved in dispatching requests handled by PHP’s built-in development server.
breakpoint set --name php_cli_server_dispatchcontinue
I then sent a simple HTTP request to the server.
LLDB stopped inside sapi/cli/php_cli_server.c, at approximately line 2303:
SG(server_context) = client;
This time, I wasn’t staring at anonymous addresses or assembly instructions. I could inspect the call stack, see the C source code, and examine the actual php_cli_server_client structure.
A backtrace showed the path through the server’s event loop:
php_cli_server_dispatch()php_cli_server_recv_event_read_request()php_cli_server_do_event_for_each_fd_callback()php_cli_server_poller_iter_on_active()php_cli_server_do_event_for_each_fd()php_cli_server_do_event_loop()do_cli_server()main()
A screenshot for the side-by-side comparison about with and without symbol
A Debugging Lab, Finally
At this point, I had what I was looking for: a PHP 8.4.26 environment where I could reproduce the vulnerability, attach LLDB from the host, and inspect PHP internals with matching DWARF symbols.
It wasn’t a byte-for-byte reproduction of the original PHP Docker image, but that was no longer the point. The rebuilt executable and its debugging symbols matched, and I could step through the source instead of staring at assembly.
That was enough to start the real investigation.
An Unexpected Bonus from My LLM
There was one more surprise.
While testing the rebuilt environment, Claude Code helped identify an issue in the PoC’s execution-proof verification. The proof command wrote its output directly to the TCP socket, after PHP had already completed its chunked HTTP response. The HTTP client could stop reading before those extra bytes were observed.
Replacing the HTTP response reader with a raw socket reader made a noticeable difference. The original PoC had succeeded in roughly three out of five attempts; our modified version passed all ten runs in the initial test batch.
But there was a small twist.
Claude initially explained the intermittent failures in terms of TCP segment boundaries. That sounded plausible, but I wasn’t entirely convinced. I brought the explanation to ChatGPT for a second opinion, which pointed out that TCP is a byte stream and that Python’s buffered I/O behavior deserved closer examination.
Claude accepted the correction and refined its explanation.
That little exchange was a useful reminder: having two LLMs agree—or disagree—doesn’t establish the truth. The source code and experiments still have the final say.
I started this project hoping AI could help me investigate a vulnerability. I ended up finding another useful role for it: challenging the explanations produced by another AI.
Not a bad bonus.
How Much Did This Cost?
One last detail worth sharing: almost all of the hands-on investigation in this post was carried out with Claude Code, powered by Opus 4.6, with ChatGPT occasionally acting as a second opinion.
The reported LLM usage cost was approximately $47.
That covered the work of investigating the Docker environment, rebuilding PHP with debugging symbols, setting up LLDB, troubleshooting the PoC, and improving its execution-proof verification.
Of course, $47 doesn’t account for my own time, the existing PoC, or the experience needed to question the model’s conclusions. And we haven’t even started the full root cause analysis yet.
Still, I found the number interesting. For less than $50 in reported model usage, I had a working source-level debugging lab, a more reliable PoC verification path, and several hypotheses that had already been tested and revised.
That’s a useful data point for anyone curious about what AI-assisted vulnerability research actually looks like in practice.
What’s Next?
Now that the lab is ready, it’s time to investigate PHP2Shell itself.
In Part 2, I’ll move beyond reproducing the PoC and start digging into the PHP internals behind the vulnerability: memory allocation, request lifecycle, and the conditions that make the exploit possible.
The debugging lab is available on GitHub. Feel free to explore it and follow along as we dig into PHP2Shell in Part 2.


Leave a Reply